Gallery of Research-related Movies and Images

Comparison different ways to model interaction between turbulence and reaction front


(10MB Movie)

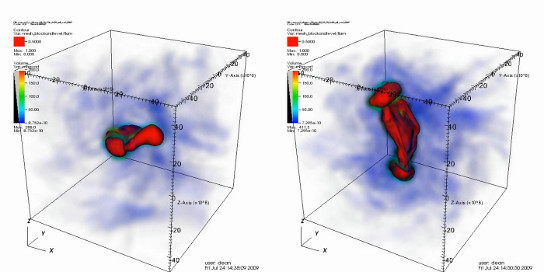
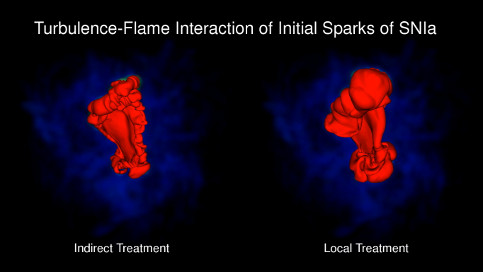
Simulation of the early burning phases of a Type Ia supernova comparing the evolution of the propagating reaction front using two different ways of accounting for interaction between the turbulence and the front. The colored shading (predominantly blue at low speeds) shows the turbulent velocity field. The red surface shows the location of the thin reaction front where carbon and oxygen is fused to iron-group material. The simulation begins with the newly-ignited propagating reaction front. An increase in the turbulence near the front can be seen in some places.

The simulation on the left does not directly model the effects of turbulence to wrinkle and accelerate the flame. This may cause the propagation rate to be understimated due to the finite cell size of the simulation. The simulation on the right uses a model to enhance the propagation of the reaction surface due the microscale wrinkling expected from measuring the local turbulence field near the reaction front. This leads to slightly faster propagation and makes the surface look smoother, as it is more representative of the average position of the front that is wrinkled on scales too small capture.

Comparison of influence of pre-ignition velocity field on burning evolution


(4.1MB Movie)
Simulation of the early burning phase of a Type Ia supernova comparing the evolution of the propagating reaction front under two different pre-ignition turbulent velocity fields. The colored shading (predominantly blue at low speeds) shows the turbulent velocity field. The red surface shows the location of the thin reaction front where carbon and oxygen is fused to iron-group material. The simulation begins with the newly-ignited propagating reaction front. An increase in the turbulence near the front can be seen in some places.

Type Ia Supernova via Deflagration-Detonation Transition


(4.2MB Movie)

This movie shows the products of fusion in a Type Ia supernova exploding via the deflagration-detonation transition mechanism. The frame shows half of a cut-plane through the star. The snapshot to the left is from when the detonation has consumed almost half the star. The blue lines are contours of constant density spaced in powers of 10 starting 100=1 g/cc at the outside. The red contour is 2x10⁷ g/cc. The colors indicate various products of the fusion of the initial Carbon, Oxygen and Neon (Yellow): Red is mostly Silicon and Oxygen, Green Silicon-group material, and Black Iron-group material. The simulation is performed in cylindrical symmetry, with the symmetry axis at the left edge of the plot.

The deflagration phase constitutes the first approximately 1.2 seconds of the evolution. During this time a subsonic reaction front, or flame front, which is driven unstable by the buoyancy of the burned material, fills the inner portion of the star. The breakup of the perturbed initial burning surface is an example of the Rayleigh-Taylor instability. As a consequence of the spherical geometry this quickly leads to a complex structure of rising and falling plumes and spun-off eddies.

When the flame reaches a density of approximately 107 g/cc, it is hypothesized that the interaction of turbulence with the broadening reaction front leads to a detonation. In the case of this simulation, detonations have been lit at the location and time where the tops of the rising plumes cross this density.

Type Ia Supernova via Gravitationally Confined Detonation


(1.5MB Movie )

This movie shows the products of fusion in a Type Ia supernova exploding via the gravitationally confined detonation mechanism. This snapshot is shortly before detonation begins. The Blue line represents the star's surface and the colors indicate various products of the fusion of Carbon and Oxygen: Red is mostly Silicon and Oxygen, Green mostly Silicon, and Black mostly Iron-group material.

The simulation is performed in cylindrical symmetry, with the symmetry axis at x=0 as indicated in the movie. The data is mirrored across this axis for visualization purposes, leading to the left-right symmetry.

Buoyancy Driven Flame


(7.5MB Movie )

This movie shows the flame surface and the vorticity field in a simulation of a buoyancy-driven turbulent flame. Gravity is pointing to the left, so that to the left is "down". As the flame burns up the channel, the surface becomes unstable because the ashes are less dense than the fuel. The simulation demonstrates that the turbulence created by the flame is not necessarily co-located with the flame surface itself.